Carbon Market
Carbon Market is a place where the sellers and buyers sell/buy carbon credit, right to emit Greenhouse Gases (GHG). Mechanism and system of Carbon Market is almost as the same as other exchange market and as the carbon markets are operating on market basis, the market is said to encourage reducing GHG emission in the most efficient manner. This is one of the means for the carbon credit sellers to find carbon credit buyers in the market other than having direct deal with buyers. Concept of Carbon Trading, Market Trend and Type of Carbon Credit are available at chart below.
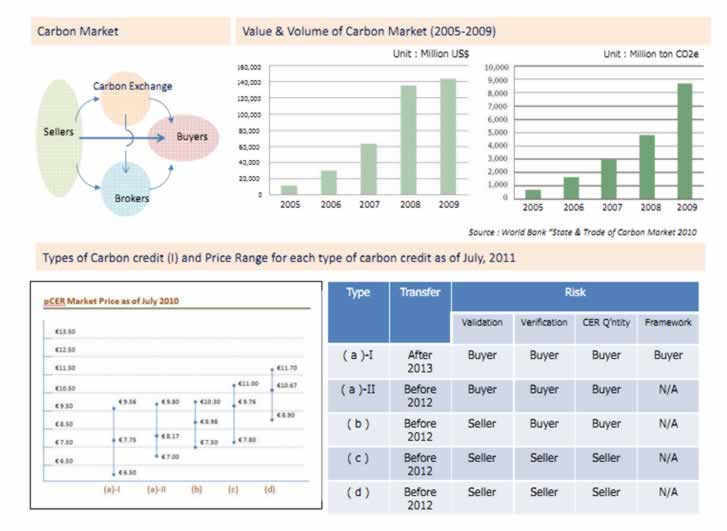 
There are 2 types of Carbon Credits or Primary CERs or pCER, which are purchased from original party and Secondary CER or sCER, which are resold in marketplace. Table 5. shows movement of pCER transaction in the market in 2007-2009 period.
Year |
2007 |
2008 |
2009 |
Volume (MtCO2) |
300 |
1,000 |
1,000 |
Amount (USM$) |
5,100 |
26,300 |
17,500 |
Average Price ($) |
17.0 |
26.3 |
17.5 |
Demand & Supply for Carbon Credit
1) Demand
It is said that total demand for carbon credit for the first committed period of the Kyoto Protocol (2008-2012) remain 1,245tCO2e in total, of which breakdown is approximately 890tCO2e from EU, 300 tCO2e from Japan and 25tCO2e from Others. Table 1 indicates trend of the demand for carbon credit. It shows sharp decline (approx.49% from the year of 2008) of the demand due to economic recession in the world and Table 2 shows breakdown of the demand for carbon market in the world as of the year 2010 and Table 2. indicates details of balance between supply & demand.
Chart 1 below indicates that there are only 231MtCO2 of carbon credit are not yet procured to the potential buyers, while the remaining or 1,041MtCO2 are said to procured already. However the 231MtCO2 of un-procured carbon credit includes quantity which is going to be transferred under existing Emission Reduction Purchase Agreement.
2) Supply
As Chart 1. Above shows, there is 3,025MtCO2 of Carbon Credit including Assigned Amount Unit (AAU), Removable Emission Unit and CER (Certified Emission Reduction) available in the market. Among three type of Carbon Credit, Chart 2. indicate supply source of CER by country.
Year |
2008 |
2009 |
2010 |
Estimation |
2,435 |
1,630 |
1,245 |
Change (%) |
|
-32% |
-25% |
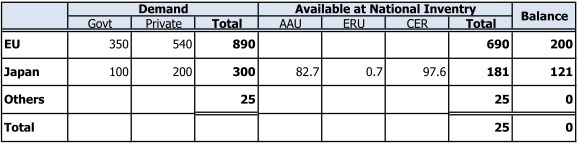
Table 1. Demand for Carbon Credit (Left) and Table 2 Breakdown of Demand for Carbon Credit (Right)
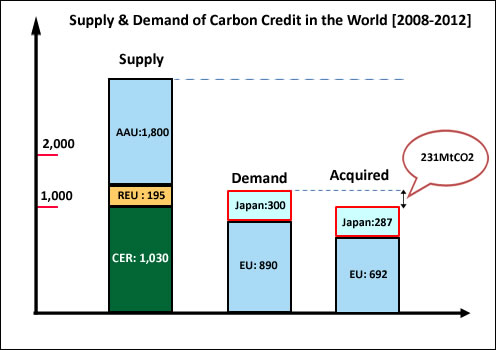 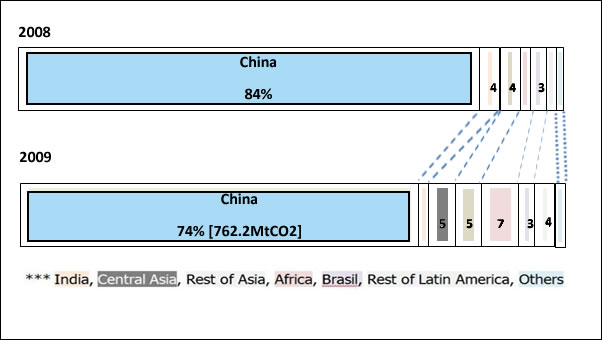
Chart 1 Demand & Supply for Carbon Market & 2. Breakdown of CER supply-ability by Country (2008 & 2009)
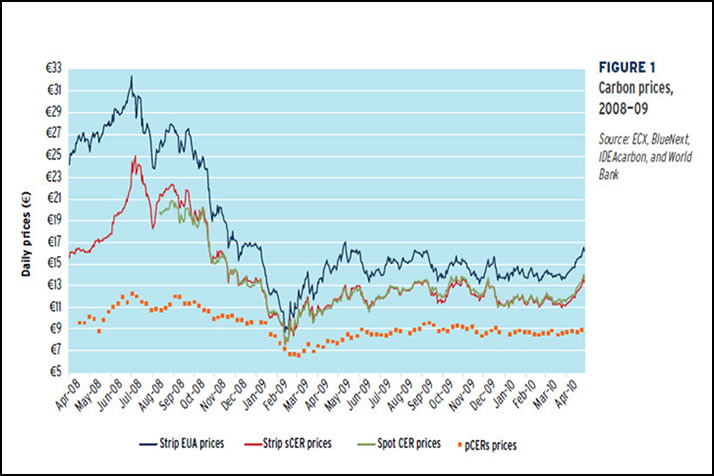
Carbon Credit Pricing Factor in the Market
- International Framework for climate change after 2013
- EU’s policy on EUETS
- World Economy
- Fossil Fuel Price
- Weather Condition in Industrialized Countries
- Technologies Innovation on Mitigation Actions (Energy Saving, Energy Efficiency, Clean Technologies etc)
[Source of Information : State and Trends of the Carbon Market 2010 (World Bank)]
|